




WordPress performance optimization means reducing load time, improving responsiveness, and keeping page layouts stable enough to meet Google’s Core Web Vitals thresholds on every visit. Largest Contentful Paint (LCP) must load in under 2.5 seconds, Interaction to Next Paint (INP) must respond in under 200 milliseconds, and Cumulative Layout Shift (CLS) must stay below 0.1 to avoid jarring visual instability. For mid-to-large B2B and B2C organizations investing in custom WordPress websites, especially teams focused on UX, SEO, lead generation, and long-term marketing ROI, those benchmarks affect search visibility, user trust, conversion rates, and the efficiency of paid traffic.
This guide walks through each metric, explains why WordPress sites miss them, and lays out the fixes in the order that delivers the most impact. You’ll see how server limits, CSS and JavaScript, image handling, plugins, theme complexity, font loading, caching, and database hygiene affect performance, along with how to measure issues accurately and approach optimization in a structured way.
Key Takeaways
WordPress performance optimization is the practice of systematically reducing load time, improving responsiveness and stabilizing visual layout on WordPress sites so they pass Google’s Core Web Vitals thresholds and deliver a better user experience. Here is what this guide covers.
- The three Core Web Vitals thresholds you need to hit are LCP under 2.5 seconds, INP under 200 milliseconds (with under 100 milliseconds as the aspirational target) and CLS under 0.1. Google evaluates these using real visitor data at the 75th percentile over a 28-day window.
- You must measure both field data from Google Search Console and lab data from PageSpeed Insights before changing anything. Lab scores can improve immediately while field data takes days or weeks to update, and the two frequently disagree.
- The fastest wins come from better hosting, server-side and browser caching plus a content delivery network (CDN), and disciplined image optimization using WebP or AVIF, compression, correct sizing and lazy loading for offscreen media.
- Plugin and theme choices on a WordPress website directly affect time to first byte (TTFB), Largest Contentful Paint and Interaction to Next Paint. Auditing and simplifying them is a core part of any performance optimization framework.
- Parachute Design tackles performance in a structured engagement: benchmark current metrics, prioritize fixes by impact, implement on a staging environment, then validate against Core Web Vitals before deployment.
Why WordPress performance matters for SEO, revenue and user trust
Site performance is not a technical vanity metric. It directly affects whether visitors stay, convert and return. For B2B organizations in Canada and the United States, where a single qualified lead can be worth thousands of dollars, even small speed improvements translate into measurable business gains.
The business case is measurable, and Google’s own commissioned research provides the strongest evidence. A study of 37 retail and travel brands covering more than 30 million user sessions found that a 0.1 second improvement in mobile site speed lifted retail conversions by 8.4 percent and average order value by 9.2 percent. For lead generation sites, which is the closest analogue to most B2B marketing, form submissions rose 21.6 percent. Separate Google research puts the cost of getting it wrong at a 123 percent increase in the probability of a mobile visitor bouncing as load time stretches from one second to ten. For a lead generation site running paid campaigns, that is wasted ad spend and lost pipeline.
Google uses Core Web Vitals to evaluate user experience quality as part of its ranking systems. Pages that fail the thresholds may lose visibility in competitive search results, and slow sites can further hurt crawl efficiency and conversions. Slow TTFB also reduces crawl efficiency, meaning search engines spend less time indexing fresh content on large sites. Monitoring Core Web Vitals is essential to optimize user experience and protect SEO rankings over time.
Fast, stable WordPress sites also support better analytics accuracy, smoother marketing experiments and more effective ad spend by reducing abandonment on landing pages. At Parachute Design, we treat speed and UX as part of the same design problem rather than an afterthought, because strong website performance underpins every other marketing effort.

What actually makes a WordPress site slow
Most slow WordPress sites suffer from a combination of five root causes rather than a single issue: server and hosting limitations, render-blocking CSS and JavaScript, unoptimized images and media, plugin bloat and heavy theme architecture. This article works through them in the order that most affects Core Web Vitals.
These problems rarely appear overnight. They start small during initial development and compound over years of content growth, plugin installs and design changes. A site that scored well at launch can gradually degrade as teams add tracking scripts, install new form builders, upload high-resolution photography and switch themes.
The sections below map each cause to specific metrics. Server issues hit TTFB and LCP. JavaScript overhead hits INP. Layout behaviour hits CLS. You can scan to the bottleneck you suspect, but a full audit usually checks all five areas to optimize WordPress performance properly.
Server response time: hosting, PHP and database bottlenecks
Slow hosting is the most common reason a WordPress site’s speed disappoints. Limited CPU, insufficient RAM and overloaded shared environments all increase time to first byte. TTFB measures the time from request initiation to the first byte received by the browser, and a TTFB under 200 milliseconds is ideal for business-critical pages.
Choosing a reliable hosting provider is crucial for website speed, and selecting the right hosting plan for your site’s traffic and resource needs helps avoid slowdowns caused by hosting limits. Shared hosting packs many sites onto one web server with shared server resources, leading to inconsistent performance. A virtual private server offers dedicated resources at moderate cost. Managed WordPress hosting optimizes server performance for WordPress sites with built-in page cache, automatic updates and tuned PHP configurations. Cloud infrastructure allows scaling for high traffic sites but requires more operational expertise.
On the back end, uncached database queries, a missing object cache and bloated autoloaded options in the WordPress database increase PHP processing time on every page load. Check theme and plugin compatibility before upgrading PHP, then move to a supported version: each recent release has improved throughput for WordPress workloads, and anything still on PHP 7.4 is running a version that stopped receiving security support years ago. The size of the gain depends heavily on theme and plugin code, so benchmark your own stack rather than relying on a headline percentage.
Render-blocking CSS and JavaScript
Large, unminified CSS files and synchronous JavaScript files loaded in the document head block the browser from painting above-the-fold content. This directly hurts both First Contentful Paint and Largest Contentful Paint.
Complex themes and plugin bundles often enqueue multiple stylesheets and scripts on every page, even when the features they power are not used on that template. The result is unused CSS and unnecessary JavaScript files inflating every request.
Minification reduces file size by stripping whitespace, comments, and redundant characters, clearing render-blocking resources from the critical path to first paint. Savings vary widely by codebase, so measure your own before and after rather than relying on a headline percentage. Techniques such as critical CSS extraction, deferred JavaScript loading, and async loading of third-party scripts address this bottleneck directly. Performance plugins can automate much of the work, but configure them carefully and test them on a staging environment first.
Unoptimized images and video
Image optimization is the highest-leverage fix on most WordPress sites because images are the heaviest thing on the page. On the median mobile page, images account for 911 KB of a 2,164 KB total, roughly a third of all bytes, according to the 2025 HTTP Archive Web Almanac. On image-heavy WordPress builds, the share runs considerably higher, especially when hero banners, full-width backgrounds, and uncompressed product photography are uploaded at their original resolution.
Compress images using modern formats. Google puts WebP lossy images at 25 to 34 percent smaller than comparable JPEG at an equivalent SSIM quality index, and WebP lossless at 26 percent smaller than PNG. AVIF delivers further savings on supported browsers. Correct dimensioning, responsive srcset attributes and compression are all essential for good LCP.
Image optimization plugins and CDNs with built-in image transformation can automatically convert and compress uploads. Compression plugins can automatically optimize images on upload without manual effort. For video and large embeds, external hosting and lazy loading of offscreen media prevent these assets from blocking the initial render.
Plugin overhead and third-party scripts
Every active WordPress plugin adds PHP execution time, database queries and often extra HTTP requests. Reducing HTTP requests improves page load speed significantly, and minimizing them enhances overall user experience. Collectively, excessive plugins harm INP, TTFB and overall stability.
Typical heavy hitters include visual builders, form plugins (even a contact form plugin can enqueue scripts site-wide), WooCommerce extensions, marketing automation tools, analytics pixels and chat widgets. Outdated themes and plugins can further slow your website. Regular updates improve WordPress performance and security, and help protect against known vulnerabilities.
A structured plugin audit helps identify redundant functionality, replace multi-purpose bundles with leaner custom code, and disable scripts on pages that do not use them. In practice, many performance improvements come from reducing complexity rather than adding more optimization plugins. Fewer unnecessary plugins means fewer conflicts and a smaller attack surface for security risks.
Theme architecture and front-end complexity
Multipurpose themes with numerous layout options, animations and bundled components generate bloated markup and excessive DOM size. Heavy layout logic, nested containers and dynamic content injection degrade both cumulative layout shift and interaction responsiveness. Use lightweight themes to improve WordPress site speed and reduce the amount of CSS and JavaScript the browser must parse.
A custom WordPress theme tailored to a specific design system loads only the components each template needs. At Parachute Design, we pair custom theme development with a performance budget to keep CSS, JavaScript and DOM size under agreed thresholds, ensuring site performance holds up as content scales.

How to measure WordPress performance before you change anything
Conduct regular performance audits using tools like PageSpeed Insights before making changes. The most common mistake teams make is tuning for a single synthetic score instead of understanding the difference between field data and lab data. WordPress recommends measuring performance with Core Web Vitals, and getting the measurement right is the prerequisite for every optimization decision.
Google ranks based on field data collected from real users over a 28-day window. Lab tools like Lighthouse simulate a controlled visit for diagnosis. A lab score improving does not mean the field assessment has passed, and the two can disagree for weeks. Regular performance monitoring helps identify slow pages and bottlenecks before they compound.
Capture a baseline using Google Search Console’s Core Web Vitals report for field data, PageSpeed Insights for combined field and lab views, and at least one waterfall tool such as WebPageTest for detailed resource timing. Every major change should be tested on a staging environment and re-measured with the same tools to verify real gains.
Field data: the Search Console Core Web Vitals report
Google Search Console aggregates Core Web Vitals field data from the Chrome UX Report as a 28-day rolling average. Improvements in site performance can take days or weeks to appear in this report because the data reflects real visitors’ experiences over time.
The report groups URLs into “Good”, “Needs improvement,” and “Poor” for each metric. The thresholds are: Largest Contentful Paint under 2.5 seconds, Interaction to Next Paint under 200 milliseconds, and Cumulative Layout Shift under 0.1. Google evaluates these at the 75th percentile of page loads, meaning at least 75% of visits must meet the threshold for the URL group to pass.
Segment by URL patterns, page type or template to pinpoint problem areas. Blog archives, product pages and landing pages often behave very differently. For a deeper dive on how Google uses these metrics, read our Core Web Vitals guide for B2B websites.
Lab data: PageSpeed Insights and Lighthouse
PageSpeed Insights shows field data at the top when enough Chrome UX Report samples exist, followed by a Lighthouse lab run that simulates a single visit. The lab section has actionable diagnostics.
Key lab metrics to watch for a WordPress performance optimization project include time to first byte, First Contentful Paint, Largest Contentful Paint, Total Blocking Time (a lab proxy for INP), and DOM size. Chrome DevTools and Lighthouse in the browser provide more detailed breakdowns, including long tasks on the main thread and specific scripts causing delays.
Why your lab score and your field assessment disagree
Lab and field results diverge for several reasons: lab tools use simulated network throttling and CPU slowdowns that may not match your audience’s real conditions; field data averages experiences across diverse mobile devices, desktop browsers, VPN connections and geographic locations; and the 28-day averaging period means field data lags behind real-time changes.
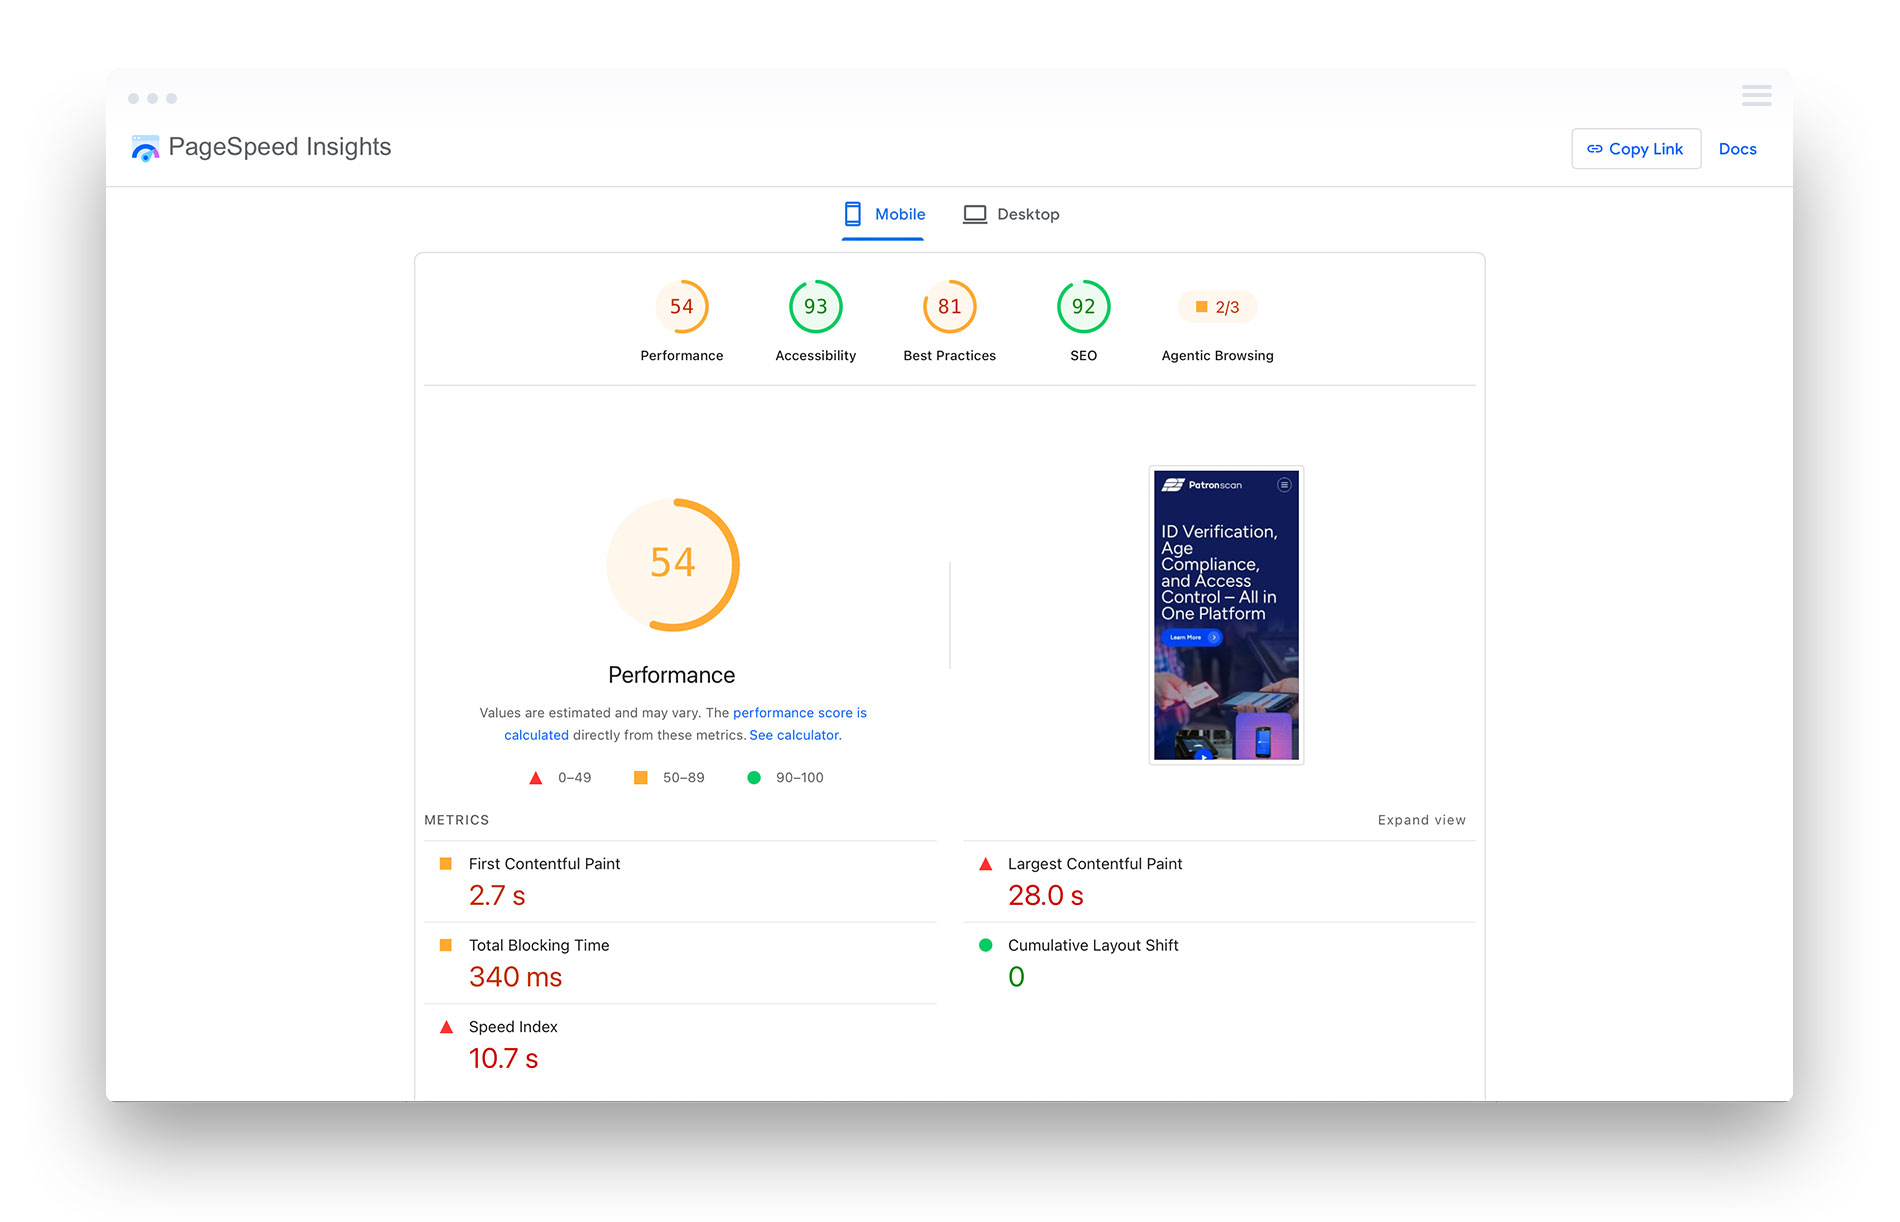
A client engagement makes this point better than the theory does. When we benchmarked Patronscan on September 4, 2026, the PageSpeed Insights lab score read 54 on mobile and 63 on desktop. Those are the kind of numbers that trigger an urgent email from a marketing team. The field data on the same reports told a different story. Interaction to Next Paint measured 187 milliseconds on mobile and 71 milliseconds on desktop, both inside the threshold, and the site was passing its Core Web Vitals assessment on real user data.
Nothing was broken. A lab score in the fifties and a passing field assessment can describe the same website on the same day, because they measure different things. Had we optimized for the lab number alone, we would have spent the client’s budget chasing a score that was costing them nothing in search. The work that followed was prioritized against the field data, which is the one of the two that Google actually ranks on.
You will still see the lag in the other direction. A site that fixes a genuine problem often shows an improved lab score the same afternoon and waits three to four weeks for Search Console to move from “Needs improvement” to “Good”, because the field report is averaging 28 days of real visits. That is expected behaviour, not a sign the work failed.
Here is the same Patronscan property on mobile, eleven days apart. The first report is the September 4 benchmark described above: a performance score of 54, on a site that was passing its Core Web Vitals field assessment that same day. The second was captured on September 15, after the remediation work: 98. Desktop moved from 63 to 100 over the same period. Read both halves of that. The lab score improved because real, lab-measurable problems were fixed: fine-tuning the Perfmatters configuration, adding srcset parameters so the browser could choose an appropriately sized image, optimizing the media files themselves, and trimming the DOM. The field assessment was already passing before any of it began.
Before: mobile, September 4, 2026
After: mobile, September 15, 2026
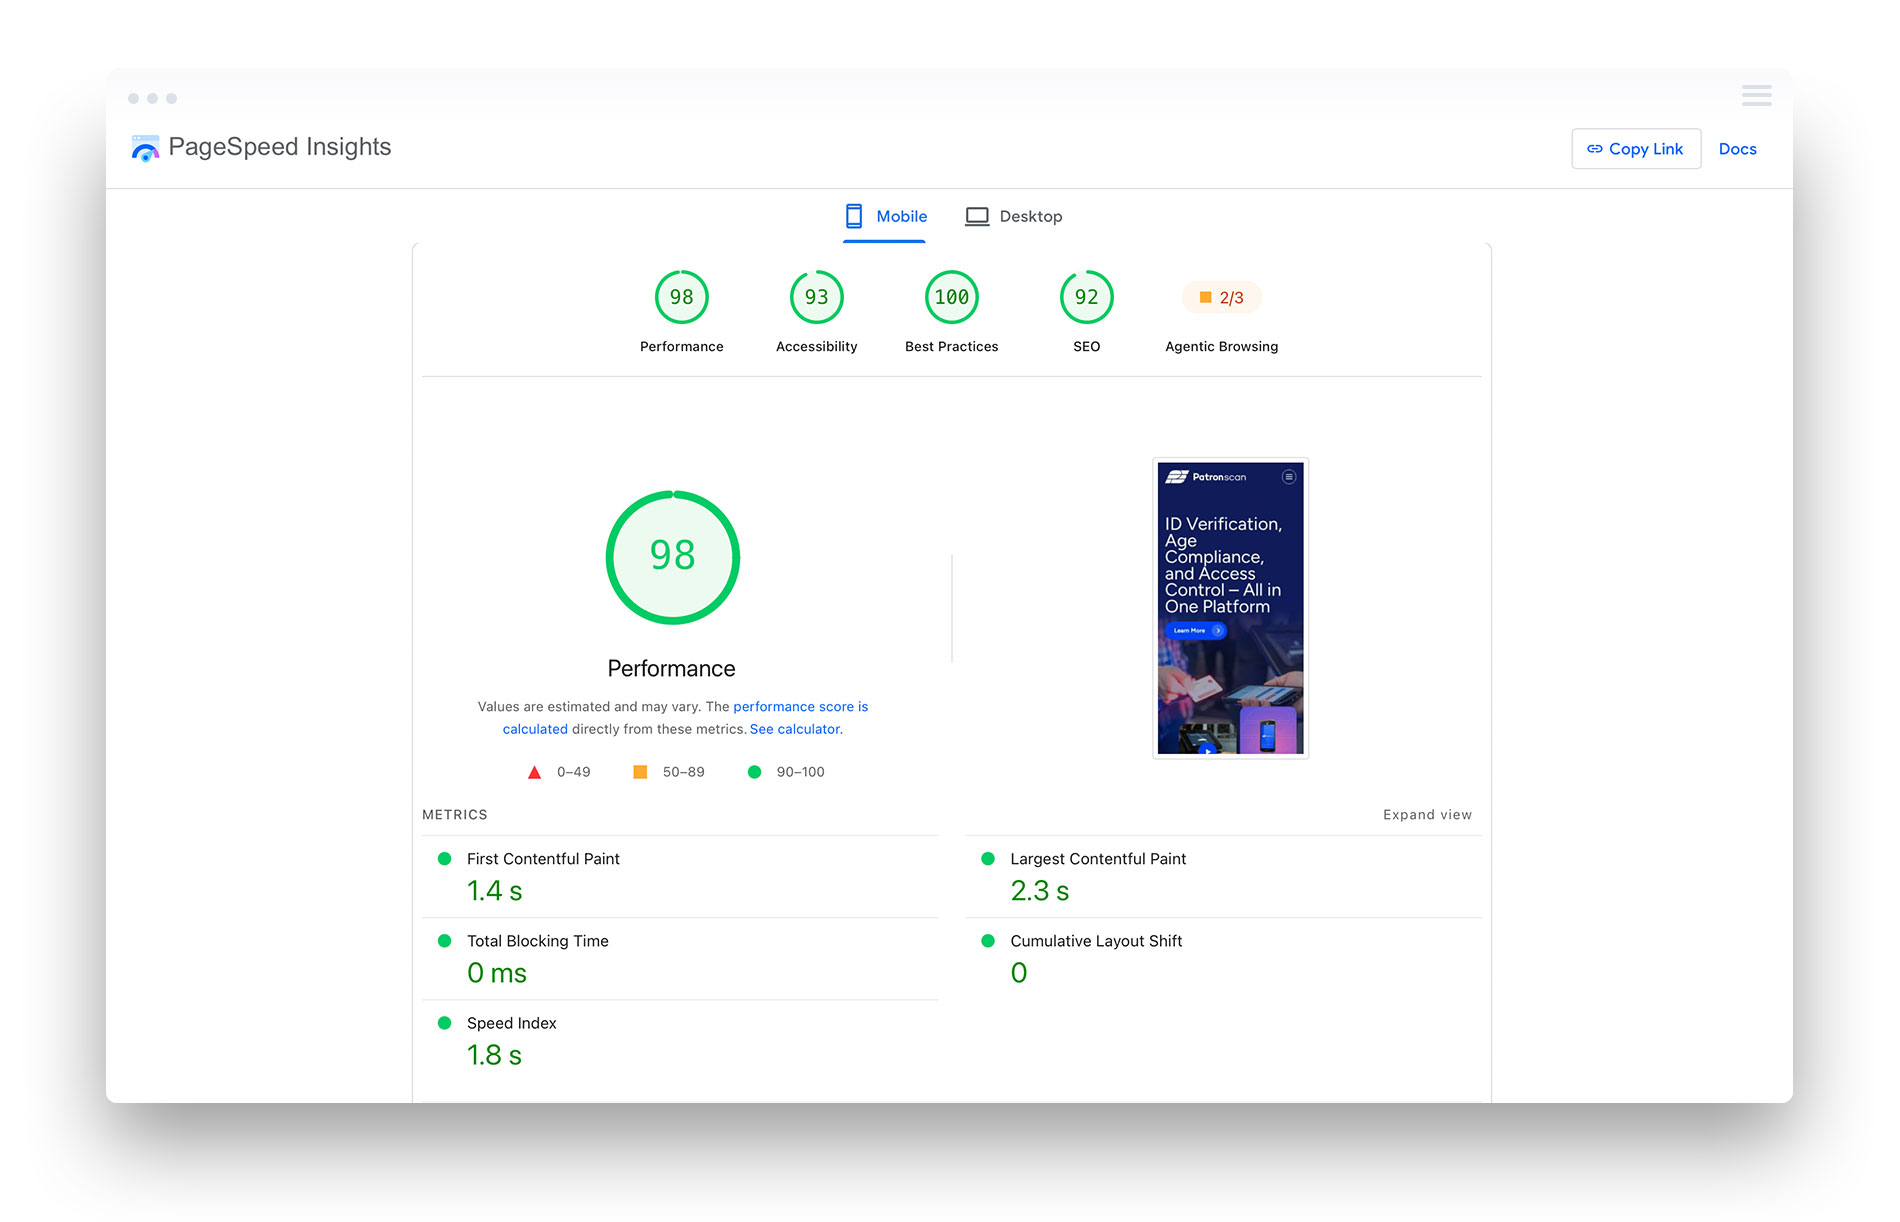
Eleven days is the honest interval for the lab side. The field side took longer because the Chrome UX Report was still averaging 28 days of visits that included the slower version of the site.
Treat lab data as a diagnostic map and field data as the performance KPI you report to leadership. Consistent, fast experiences for real users matter more than chasing a perfect 100 in Lighthouse, especially for B2B audiences with varied devices and VPN usage.
Largest Contentful Paint: what slows it and how to fix it
Largest Contentful Paint measures how long it takes for the largest visible element in the viewport to render. The good threshold is under 2.5 seconds, and it is the hardest of the three metrics to pass on mobile. In July 2025, 62 percent of mobile pages recorded a good LCP, against 77 percent for Interaction to Next Paint and 81 percent for Cumulative Layout Shift, with just 48 percent of mobile pages passing all three. LCP is where most WordPress remediation work lands.
On most WordPress pages, the LCP element is a hero image, a large heading block or a background image in the banner area. The primary causes of slow LCP are slow TTFB, oversized or uncompressed media, render-blocking CSS and JavaScript files, and unoptimized web font loading.
For a deeper technical reference, see our guide to Largest Contentful Paint for web designers. The subsections below form a checklist to work through in order of impact.
What counts as the LCP element on a WordPress page
The browser considers several element types as LCP candidates: img tags, background images on block-level elements, and large text blocks. On a typical WordPress template, this maps to the hero banner image, the main heading in a content area, or a featured image above the fold.
Use PageSpeed Insights or the Chrome DevTools Performance panel to identify the LCP element on each key template. Avoid carousels and heavy sliders in the hero area. A single optimized image with a clear call to action consistently outperforms rotating banners for both performance and conversions. Use WordPress responsive image generation plus explicit width and height attributes so the browser can prioritize and lay out the LCP element quickly.
Server response time and time to first byte
Slow TTFB directly delays when the browser can begin downloading the LCP resource. For sites targeting users in Canada and the United States, aim for TTFB under 200 to 300 milliseconds from primary regions.
Practical steps to cut TTFB on WordPress include moving to managed WordPress hosting, enabling full-page caching with server-side caching, configuring object caching with Redis or Memcached, and optimizing slow database queries. Object caching can handle thousands of requests per second, making it essential for dynamic content on high traffic sites.
Encourage collaboration between marketing teams and hosting partners to address back-end tuning rather than relying solely on front-end tricks. A hosting environment upgrade often delivers a larger TTFB reduction than any single plugin change.
Image format, sizing and preloading
Optimizing images can improve LCP by 0.4 to 1.2 seconds on most WordPress sites. For the LCP element specifically, prioritize correct dimensions, aggressive compression and modern formats like WebP and AVIF. Lazy loading delays image loading until users scroll to them, which is ideal for offscreen content but must never be applied to the above-the-fold LCP image.
Use dedicated image optimization plugins or CDN-based transformations that automatically convert and compress while maintaining visual quality. Apply preload hints for the LCP image and combine this with the fetchpriority=”high” attribute so the browser downloads it first.
Every LCP fix should be validated visually on high-resolution displays and across browsers to ensure brand imagery meets design standards.
Render-blocking CSS and web fonts
Large CSS bundles and font files can delay the first paint of the LCP element even when the image itself is optimized. Extract and inline critical CSS for above-the-fold content, then load the remaining styles asynchronously or via media queries to improve the initial load time.
For font loading, use font-display: swap or font-display: optional to keep text readable during the swap period. Preload key font files, subset character sets to only required glyphs and consider system font stacks for performance-sensitive areas. Test different strategies on staging and measure their impact on LCP in lab tools.
Interaction to Next Paint: why plugin-heavy WordPress sites fail it
Interaction to Next Paint measures overall responsiveness to user interaction across an entire session. The “good” threshold is under 200 milliseconds, with under 100 milliseconds as the aspirational goal. INP replaced First Input Delay as a Core Web Vitals metric in March 2024, making responsiveness requirements considerably stricter.
Many WordPress sites that achieve acceptable LCP still fail INP because of JavaScript-heavy themes, stacked plugins and third-party marketing scripts. Long tasks on the main thread, complex DOM operations and synchronous events after user interactions cause visible lag and poor perceived responsiveness.
For a detailed breakdown, see our Interaction to Next Paint practical guide. Improving INP usually requires structural changes to plugins, scripts and interaction design rather than a single toggle in a caching plugin.
What INP measures that First Input Delay did not
First Input Delay only measured the delay on the very first interaction a visitor made. INP captures the responsiveness of all click, tap and keyboard events during the full session. This means slow form submissions, filter toggles, navigation clicks and on-page widgets on WordPress sites can now trigger a poor score even if the first interaction was fast.
Teams should reproduce real user flows, such as product filtering, multi-step contact form submissions and pagination, while profiling with DevTools to identify interaction bottlenecks. Improving INP often surfaces UX opportunities like simplifying flows, reducing steps or deferring non-essential scripts until after the first paint.
Long tasks and the main thread
A long task in the browser is any JavaScript execution that takes over 50 milliseconds. Clustered long tasks block the main thread from handling new interactions smoothly, causing the delay users feel between a tap and a visual response.
Common long-task sources on WordPress include bundled animation libraries, complex visual builders, analytics tags and large client-side validation or filtering logic. Use Lighthouse and the Chrome DevTools Performance panel to identify the culprits. Mitigation strategies include code splitting, lazy-loading scripts when elements enter the viewport, and delegating heavy computation to web workers where appropriate.
Third-party scripts and stacked plugins
Multiple analytics tags, ad networks, chat widgets, and marketing platforms can add up to dozens of external scripts and large payloads. Each resource on a webpage generates an HTTP request, and too many HTTP requests can delay page loading on slower connections. Reducing external HTTP requests can significantly speed up your site and improve INP scores.
Marketing and development teams should jointly audit every third-party script, documenting its business value, the data it collects and its performance cost. Tactics include loading tags via a server-side container, delaying non-essential pixels until after user interaction and consolidating tools where overlap exists. Replacing plugin-based functionality with lightweight custom code designed specifically for the site is often a key step for enterprise-grade web performance.

Cumulative Layout Shift: the three things that cause it
Cumulative Layout Shift measures the sum of unexpected layout shifts during a page’s lifespan. The “good” threshold is under 0.1. Visual instability erodes user trust, causes misclicks and undermines the user experience, particularly on mobile devices where screen space is limited.
In WordPress, CLS issues almost always trace back to three causes: images and embeds without reserved space, web font swap behaviour and dynamic content injected above what is already rendered. Fixing CLS requires collaboration between designers and developers so layout decisions support stability from the outset.
For deep technical detail on scoring and edge cases, see our Cumulative Layout Shift guide for UX and SEO.
Images and embeds without dimensions
Omitting width and height on images, iframes, and embeds causes content to shift as the browser discovers their true size during loading. Always specify intrinsic dimensions or use CSS aspect-ratio boxes so the browser reserves the correct layout space from the start.
Gutenberg blocks and many custom theme components allow fixed aspect ratios for media. Ad slots, video embeds and social widgets should use placeholders or reserved containers to avoid late layout jumps.
Web fonts and the swap period
Web font loading strategies directly influence CLS. Flashes of invisible text (FOIT) or jarring switches between fallback and final fonts raise layout shift scores, especially when font metrics differ significantly.
Use font-display: swap or font-display: optional to keep text readable while minimizing visual jumps. Subset fonts to reduce file size and consider system font stacks where brand guidelines allow, particularly for body copy. Test on both fast and slow mobile connections to observe how the font swap behaves for real mobile users.
Content injected above existing content
Dynamically inserting banners, cookie notices, promotional bars or lazy-loaded embeds above the main content causes disruptive layout shifts. Reserve dedicated space for recurring interface elements such as sticky headers, consent banners and inline notifications.
Handle ad placements and third-party embeds more safely by using fixed-height containers and loading indicators instead of pushing content down. Many WordPress-specific CLS issues resolve once you simplify the pattern of stacking multiple toolbars, notices, and overlays during a UX review.
The fixes that pay for themselves, in order
This section reframes optimization techniques as an ordered roadmap based on typical impact on LCP, INP and CLS for business WordPress sites. The list prioritizes server and network-level improvements first, then media optimization, then JavaScript and plugin complexity.
Measure each tactic against your pre-optimization baseline. Not every site needs every advanced technique to reach Core Web Vitals thresholds. Build these best practices into a repeatable workflow rather than treating optimization as a one-time clean-up, especially for sites that publish frequently or run campaigns. For a broader deployment framework, see our WordPress website launch checklist, where performance considerations are integrated from the start.
Caching and a content delivery network
Caching reduces server load by serving static content instead of regenerating pages on every request, and these layers are central to wordpress optimization for sites that need faster repeat delivery. The three key caching layers for WordPress are:
- Page cache: caching generates static HTML files to reduce server response times. Full-page caching removes PHP execution and database queries from the request path entirely for cached visitors, which is usually the single largest TTFB improvement available on a WordPress site. The size of the gain depends on how slow the uncached response was, so record the before state first.
- Browser caching: browser caching stores files locally for faster repeat visits, eliminating redundant downloads of CSS files, JavaScript files and images.
- Object caching: object caching can handle thousands of requests per second, reducing the load on your WordPress database for dynamic content.
A content delivery network CDN serves static assets from edge locations closer to visitors. CDN caching reduces latency by serving content from nearby servers. CDNs store copies of static assets like images and CSS files across multiple servers worldwide. Using a CDN can improve page load times significantly and can also enhance security by mitigating DDoS attacks.
A practical combination is managed WordPress hosting with built-in page cache plus a reputable CDN, or using WP Rocket for page and browser caching where hosting does not provide it. Exclude sensitive pages such as carts and dashboards from full-page cache while keeping the rest of the site aggressively cached.
Image format and delivery
A concrete image optimization workflow for WordPress:
- Resize images before upload to the maximum display dimensions needed.
- Compress aggressively. Optimizing images can improve LCP by 0.4 to 1.2 seconds.
- Convert to WebP or AVIF. Convert to WebP or AVIF, which Google measures at 25 to 34 percent smaller than comparable JPEG at an equivalent SSIM quality index.
- Serve via CDN where possible for faster global delivery.
Implement lazy loading for offscreen images but never for the critical above-the-fold LCP element. Lazy loading delays image loading until users scroll to them, which saves bandwidth without harming the initial load time for content the visitor sees first.
Compression plugins can automatically optimize images on upload. Define an internal standard such as maximum hero image file sizes under 200 KB or mandatory use of responsive srcset attributes across all templates to maintain optimal performance.
Script deferral and delayed execution
Reduce render-blocking JavaScript by deferring non-critical scripts, delaying execution where possible, loading analytics after initial user interaction, removing unused libraries, and using minification to improve performance. Minified CSS and JavaScript improve loading times significantly, and tools like Autoptimize automate the minification process alongside deferral.
GZIP compression reduces file sizes for faster downloads and is widely supported by modern browsers and servers. GZIP can significantly improve loading times on slower connections, and implementing it is a simple server configuration task that complements minification.
Performance plugins can automate script deferral and minification, but aggressive settings can break functionality and must be tested on staging. Audit third-party scripts to identify those you can load later, move server-side, or replace with leaner alternatives. These actions directly improve INP and Total Blocking Time scores.
Font loading strategy
Limit the number of font families and weights, subset character sets, self-host where appropriate and use font-display strategically. Preloading only the most critical font files improves initial heading and navigation rendering without overloading the network.
Coordinate with brand and design teams so typography choices support both visual identity and speed goals. In some cases, using a system font stack for body text significantly reduces both CLS risk and third-party dependencies while maintaining visual quality.
Database and revision hygiene
Post revisions and spam comments clutter WordPress databases over time. Accumulated transients, orphaned data and bloated database tables slow down database queries and increase TTFB on every page load.
Clearing post revisions, expired transients, spam comments and orphaned metadata reduces table size and shortens query time. How much it helps depends on how much has accumulated, so measure query time before and after rather than relying on an assumed figure. Cleaning up transients prevents database bloat and improves performance across the site. Autoloaded options should stay under 900 KB for optimal performance.
Practical steps:
- Limit post revisions by adding a constant to your wp-config PHP file (for example, define WP_POST_REVISIONS to 5).
- Schedule regular database optimization using reputable plugins. Using plugins like WP-Optimize can automate database cleanup tasks.
- Monitor autoloaded options size and remove unnecessary data from inactive plugins.
Database optimization improvements also speed up the WordPress admin, helping content teams work more efficiently.
The plugin audit
A disciplined plugin audit follows this workflow:
- Inventory all active WordPress plugins and document each one’s purpose.
- Categorize by function and identify overlapping features.
- Measure impact using tools like Query Monitor to see which plugins add the most database queries and HTTP requests.
- Consolidate or remove unused plugins and replace heavy bundles with leaner custom code where feasible.
Document business owners for each plugin so decisions about removal or replacement have clear accountability. Apply WordPress core updates immediately for security patches, and update regularly to protect against known vulnerabilities across your entire plugin stack.
Custom development of recurring features can often replace several overlapping plugins and deliver better long-term site performance and maintainability. A disciplined plugin strategy is especially important for sites that must maintain high INP and LCP scores under heavy traffic or during campaigns.
What a WordPress performance engagement looks like at Parachute
Parachute Design approaches WordPress performance optimization as a structured engagement, not a list of ad hoc tweaks. We start with a baseline benchmarking phase, pulling Core Web Vitals field data from Google Search Console, running PageSpeed Insights and Lighthouse audits across key templates, and reviewing server logs and hosting environment configuration.
From there, we conduct an architecture and plugin audit, mapping every active script and stylesheet to the metrics it affects. We prioritize fixes by measured impact, not by how easy they are to implement. We build and test all changes in a staging environment before deployment, and we validate against Core Web Vitals thresholds using both lab and field tools.
The advantage of combining UX, branding and engineering expertise in-house is that performance decisions align with design and content strategy rather than competing with them. We do not sacrifice brand experience for a higher score. We engineer the site to meet both goals.
If your organization is looking for a structured performance review of your WordPress website, we would be glad to discuss a tailored engagement. Contact us to start the conversation.
WordPress performance optimization FAQ
For business sites, a practical target is Largest Contentful Paint under 2.5 seconds on mobile for most users, with total page loads typically completing in three to four seconds on a typical 4G connection. The real goal is meeting Core Web Vitals thresholds for LCP, INP and CLS in Google’s field data rather than chasing a specific synthetic “load time” number from any single tool. Define a performance budget per template, including maximum page weight and script execution time, aligned to these thresholds.
PageSpeed Insights scores vary because each lab test simulates slightly different network and CPU conditions and may fetch live third-party assets with fluctuating response times. The field data at the top of the report is more stable because it reflects a 28-day average of real user visits from the Chrome UX Report. Focus on recurring patterns in the diagnostics and trends over time rather than trying to optimize for a single perfect score.
A well-configured caching plugin can dramatically improve server response time and LCP, but it does not automatically fix issues with INP, CLS or inefficient themes and plugins. Core Web Vitals depend on the entire stack, including hosting, code quality, image optimization and layout stability. Treat caching as one layer in a broader optimization plan that also addresses JavaScript execution, media handling and visual design choices.
Google Search Console’s Core Web Vitals report usually takes between a few days and several weeks to reflect improvements because it uses a 28-day rolling window of field data. Low-traffic sites may take longer to accumulate enough Chrome UX Report samples for a stable assessment, while high-traffic sites may show movement sooner. Use lab tools like Lighthouse to confirm immediate technical improvements while planning stakeholder reporting around the slower Search Console update cycle.
Visual builders aren’t inherently bad, but they often encourage complex layouts, large DOM trees, and extra scripts that can slow LCP and INP if used without a performance budget. A lean, custom theme or carefully constrained component library usually offers better long-term performance and maintainability for organizations with significant traffic. If a builder is entrenched, audit and simplify templates, disable unused widgets and remove unnecessary animations to reduce overhead.
Even if most visitors are in Canada or the United States, a CDN often still improves performance by shortening network paths, smoothing traffic spikes and offloading static assets from the origin server. Cloudflare offers a free CDN plan for basic performance benefits, which is a low-risk way to test the impact. The benefit is greatest for sites with large images, heavy assets, or visitors spread widely across North America, but test with and without a CDN using the same measurement tools to quantify impact before committing.